Business Impact: Capex at Risk, New Winners Emerging
Last year’s 49 Mt target for 2030 low-emissions hydrogen is now 37 Mt, forcing industry leaders to revisit project economics or face stranded investments (IEA 2025). Slower scale-up tightens financing windows and heightens competition for low-cost electrolyzers and offtake contracts.
Companies that adjust sourcing strategies, anchor demand in high-growth regions, and structure resilient supply chains can outpace peers and secure first-mover cost advantages as electrolyzer prices and policy incentives evolve.
Key Data Shifts (2030 Forecast vs. Today)
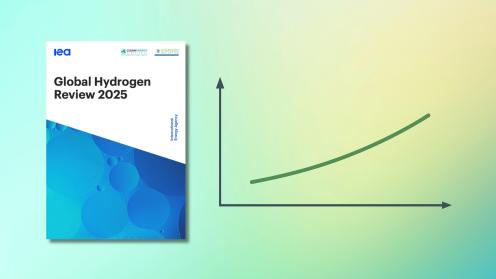
• 2030 clean hydrogen forecast: 37 Mt vs. 49 Mt in 2024 (–24%) (IEA Global Hydrogen Report 2025).
• Installed baseline: ~1 Mt today, implying a 37x growth target in five years.
• Capital expenditure window shrinks by ~18 months as projects slip from 2026 to 2027 on average due to permitting and policy lags.
China’s Cost Advantage: Business Value
China accounts for 65% of installed or near-installed electrolyzer capacity and manufactures ~60% of global modules (July 2025, IEA). Overseas suppliers quote $2,200–3,000/kW, compared with $700–1,100/kW from leading Chinese OEMs—a 2–3x price gap.
Companies leveraging Chinese-sourced electrolyzers can improve project IRRs by 200–300 basis points, but must balance supply-chain, IP, and compliance risks through dual-sourcing strategies.
Southeast Asia: The Next Demand Hotspot
Southeast Asia already consumes ~4 Mt of hydrogen annually in refining and chemical production (Ammonia, Methanol) (IEA; APERC 2024). With 25 announced green hydrogen and e-fuel projects and Singapore handling ~16% of global bunkering volumes in 2024, the region offers guaranteed offtake and faster FIDs.
Anchoring early projects in industrial parks and port corridors can deliver 10–15% higher utilization rates versus greenfield sites with untested demand.
Methodology & Assumptions
Installed or near-installed electrolyzer capacity includes systems commissioned or under construction as of July 2025 (IEA 2025). Southeast Asia hydrogen use (~4 Mt) is derived from regional refinery and chemical plant consumption data (APERC 2024). Cost figures reflect vendor quotes and published auction results in 2024–25.
Opportunity Analysis: Where to Pivot
- Reforecast project IRRs using a 37 Mt-by-2030 scenario; stress-test against 12-month delays and 50–100 bps higher debt costs.
- Secure anchor offtake with regional incumbents in SEA—incentivize offtake volumes through indexed pricing to grey hydrogen and step-down clauses tied to electrolyzer learning curves.
- Implement dual-sourcing: lock in Chinese OEM pricing for core capacity, augment with Western suppliers for critical spares and compliance buffers.
- Negotiate renewable PPAs or invest in captive generation first—treat hydrogen as a derivative product of guaranteed low-cost electrons (target $15/MWh by 2028).
- Explore port partnerships for green bunkering: start with e-methanol/ammonia in 2026–27, transition to hydrogen by 2029.
- Hedge policy risks by diversifying projects across at least three jurisdictions with stable incentives (e.g., EU, Singapore, Australia).
Call to Action: Secure Your Competitive Edge Now
Business leaders must act today to recalibrate strategy, financing, and sourcing in light of revised IEA forecasts. Delay risks eroded returns and lost market share to agile competitors capitalizing on cheaper electrolyzers and dynamic SEA demand.
Contact Codolie to stress-test your hydrogen portfolio, optimize supply chains, and access our proprietary cost-curve models. Let’s ensure your projects thrive in a tightened market and capture the next wave of low-emissions hydrogen growth.
Sources: IEA Global Hydrogen Report 2025; APERC 2024; MIT Technology Review (The Spark); Vendor pricing surveys 2024–25.
Leave a Reply